The Stereotype of The Low-Income Drunk Driver Is Contradicted By Affluent DUI Habits – As Statistics Reveal
According to 2023 National Highway Traffic Safety Administration (NHTSA) statistics, 40,901 people died in the U.S. due to road accidents. 12,429 (30%) of those fatalities were caused by drunk driving. Yet who were the drunk drivers?
This study looks further into the data to determine the answer – with socioeconomic factors a key differential. Simply put: affluent people are more likely to drink and drive than those lower down the economic scale.
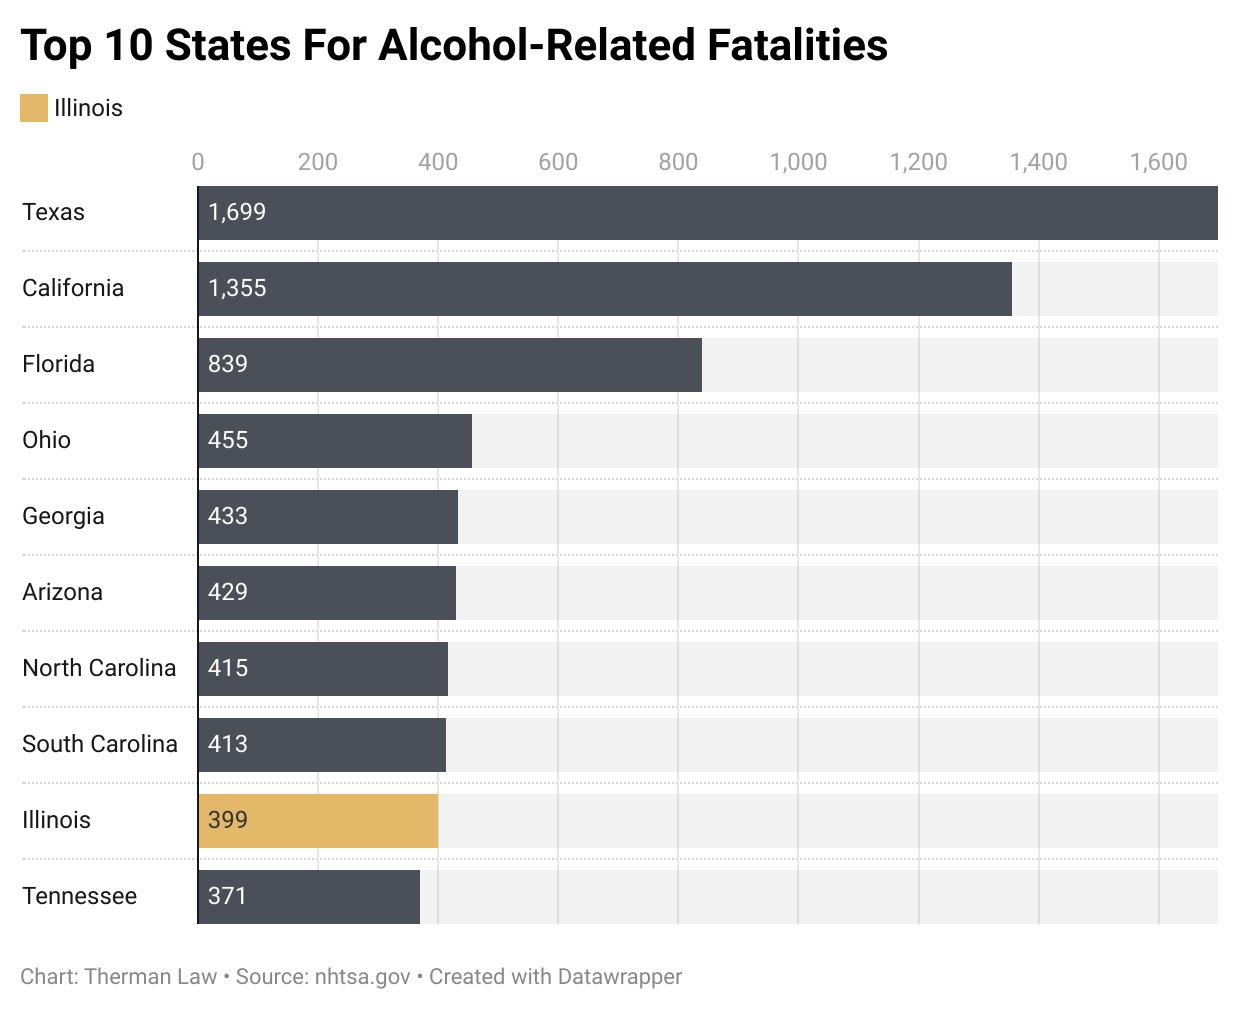
The Top Ten States For Alcohol-Related Fatalities
According to United States Census Bureau data, the median national household income in 2023 was $80,610, a 4% increase on 2022 figures. Illinois figures closely follow national trends: the median household income in The Prairie State was $81,702, 1.35% above the national average.
Of 1,241 vehicle crashes throughout Illinois, 32% (399) involved a drunk driver – with Illinois among the top 10 U.S. states with the highest number of alcohol-related fatalities, taking 9th spot.

The Midwest: An Affluent Drunk Driving Test Case
In income terms, Illinois falls within the top 20 states in the U.S., taking 18th spot. As part of this study, we’ll examine some of the wealthiest zip codes in the Midwest, and consider how drunk driving figures correlate.
While increased income is often associated with better access to healthcare and comfortable living, it also allows for greater access to non-essentials like alcohol, much more frequent social drinking, and potentially greater driver confidence regarding drunk driving.
Are Affluent Drivers Complacent About Drunk Driving Consequences?
There are compelling reasons to believe that affluent drivers may feel comparatively insulated against the consequences of drunk driving – which may drive up drunk driving fatality numbers.
Affluent drivers have privileged access to expensive, high-powered legal teams, suffer less financial hardship when issued with fines, and are certainly perceived to possess the ability to effectively navigate the system.
Study data also suggests that socioeconomic status can influence sentencing, plea deals, and even how individuals are treated during traffic stops. All of these factors may cause affluent drivers to behave with less sense of jeopardy and indulge in dangerous driving habits, their wealth effectively limiting their accountability.

A Clear Link Between Affluence And Drunk Driving
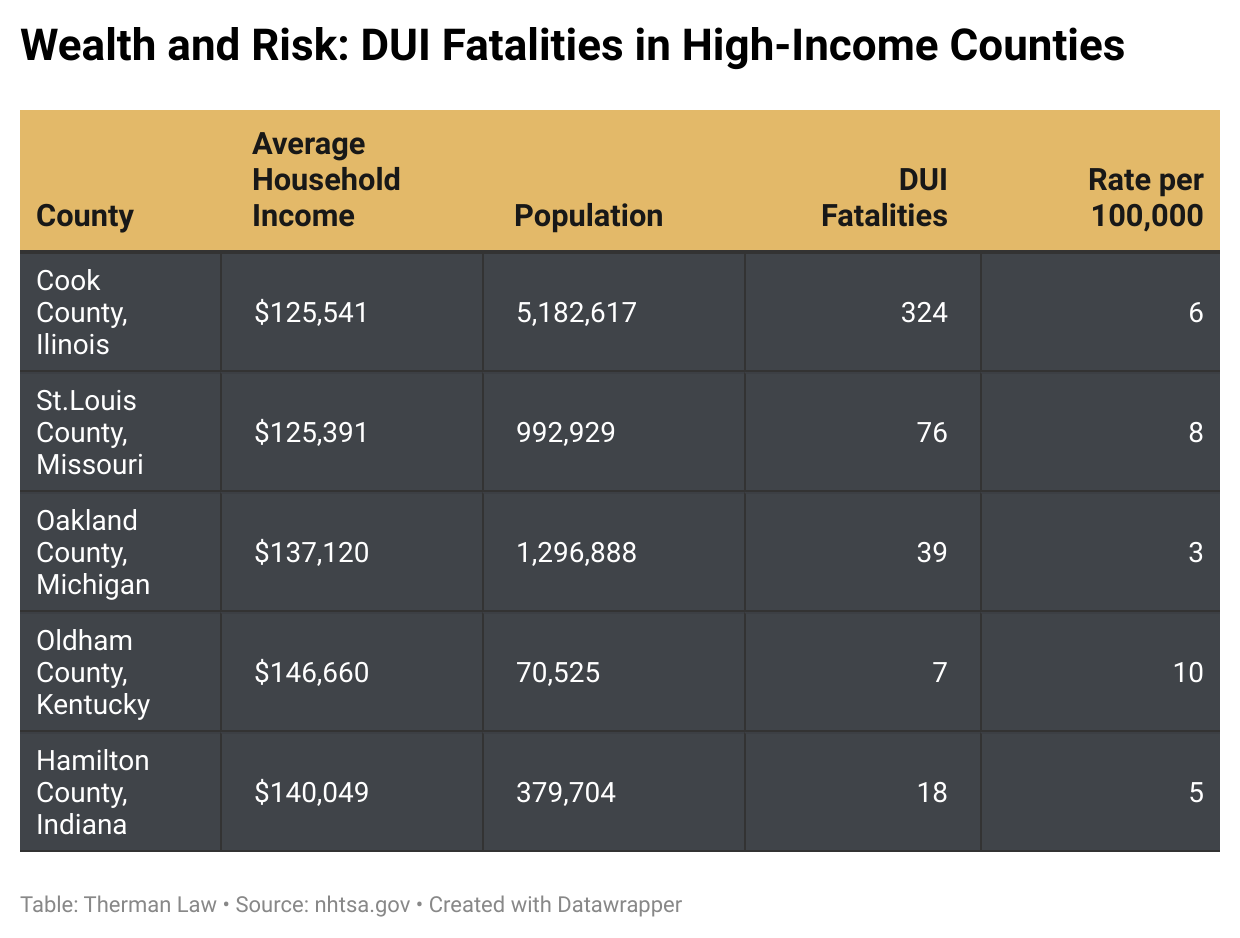
According to NHTSA data, the national drunk driving fatality rate is approximately 3.1 deaths per 100,000 people. Counties that exceed 3.1 deaths per 100,000 people are adjudged to feature above-average DUI death rates.
Oldham County, KY is the standout from the above DUI-fatality table, with a fatality rate of more than three times the national average – despite its elite status and tiny population.
This suggests an extreme drunk driving risk that could easily be overlooked due to the county’s wealth, with affluent areas apparently lacking the necessary level of public scrutiny, proportionate enforcement intensity, and community urgency to sufficiently prevent above-average DUI death rates.
St. Louis County, MO, and Cook County, IL also show significantly elevated rates, at 8 and 6 fatalities respectively, indicating that large urban areas with higher income averages also present an increased drunk driving risk.
Hamilton County, IN also exceeds the national drunk driving average (5 fatalities per 100,000), further reinforcing the trend.
Oakland County, MI is the only county on the list that (marginally) falls just below the national average.
So, these Midwestern examples certainly seem to confirm a potential link between affluent areas and higher drunk driving fatalities. This is despite residents in such areas having wide access to safer vehicles, better infrastructure, and higher public safety funding.
One invaluable way for all drivers to avoid high-risk periods on the road is to keep traffic accident windows in mind. For those Midwesterners looking to travel around the region, the worst times to hit the road or airport are usually late afternoons (4-7 PM), especially on Fridays and Sundays, when rush hour overlaps with weekend traffic.
Winter months—particularly January through March—mean lengthy delays, tailbacks, and bottlenecks, thanks to snow, ice, and freezing weather that can make for precarious driving.
March also features late-season storms, which exacerbate the danger factor. To avoid the worst, skip afternoon travel, steer clear of peak traffic days, and head out mid-morning during midweek when the weather is more stable and roads are less congested.
Widening The Net: Affluence And Drunk Driving Across The U.S.
We’ve explored the Midwest, but to emphatically confirm the trend of affluence as a link to elevated drunk driving fatality rates, we need to widen the net.
Data from other U.S. regions will help us to incontrovertibly establish a national link – with many of the wealthiest U.S. counties reporting significant drunk driving fatality rates.
For a broader perspective, let’s consider the drunk driving fatality rates in affluent areas from the Northeast, South, West, Mid-Atlantic, and Pacific Northwest.
- Nassau County, NY (Northeast)
- Forsyth County, GA (South)
- Marin County, CA (West)
- Howard County, MD (Mid-Atlantic)
- Pacific Northwest → King County, WA

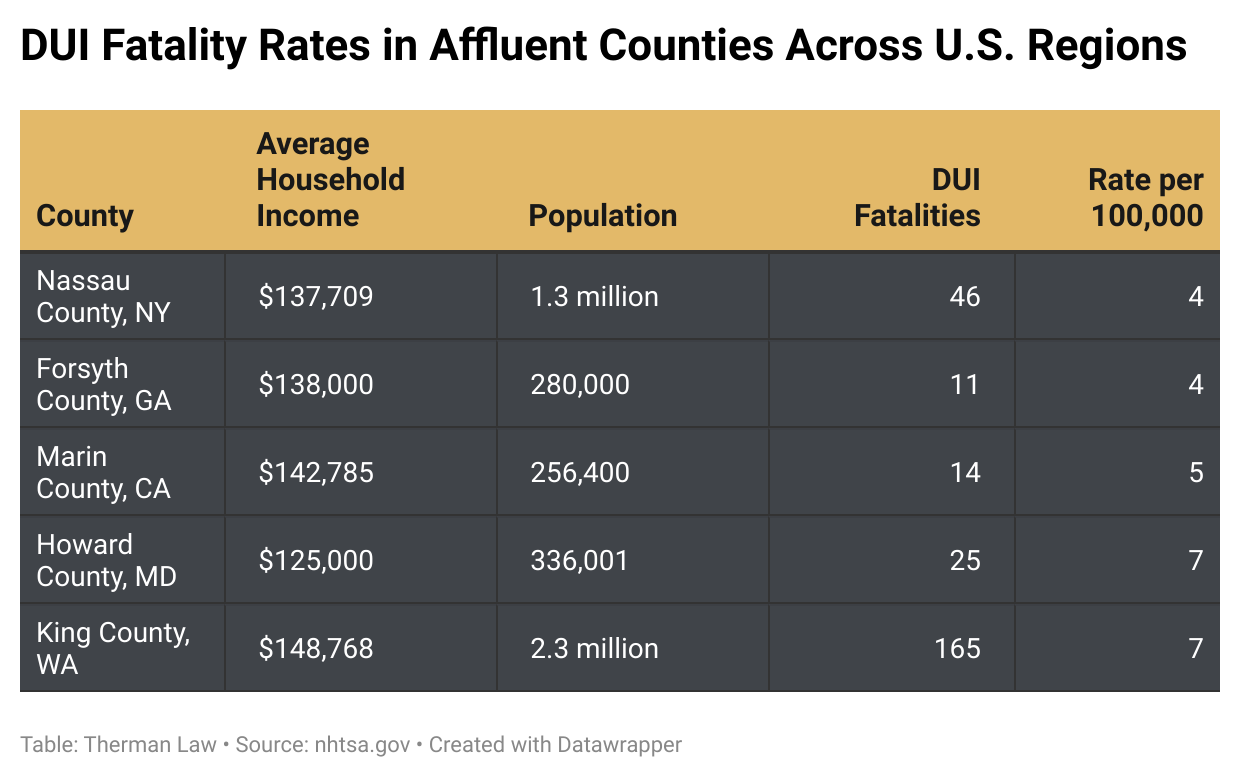
Despite enjoying average household incomes often well above $125,000 (with the national median at $80,610), these affluent counties all report alcohol-related fatality rates above the national average (3.1 per 100,000).
Howard County, MD joint-tops the list, with a drunk driving fatality rate of 7 fatalities per 100,000, more than double the national average.
King County, WA, home to Seattle’s tech giants, carries the same number (7 fatalities per 100,000), suggesting urban affluence does little to guarantee safer streets.
Similarly, San Francisco-adjacent Marin County, CA reports a surprisingly high rate (5 drunk driving fatalities per 100,000), despite its scenic, suburban, and elite reputation.
Forsyth County, GA, and Nassau County, NY carry figures just above the national average (both with 4 fatalities per 100,000) but nonetheless still demonstrate that drunk driving deaths can happen with higher-than-average frequency in affluent areas.
All the above counties share distinct commonalities: high incomes, strong infrastructure, and plenty of resources. These factors instill a false sense of security and a dangerous belief that drunk driving risk is lower due to affluence.
But the data tells a different story: easy access to alcohol, overconfidence behind the wheel, and a perceived lack of consequences can put affluent drivers at high risk.
With the summer months here, such statistics are salient, since drunk driving fatalities typically spike during the warmer months of the year. There are more people on the road, often heading off on vacation, or to an increased number of public events across the country.
But how do the different parts of the U.S. fare when it comes to summer drunk driving deaths?
Alcohol And The Summer
The South features by far the most alcohol-related traffic fatalities during the summer months – study data from 2023 puts the figure at 1,960. The West was next up with 1,075 summer fatalities – figures largely driven by states like California and Arizona.
The Midwest recorded 977 fatalities, with notable spikes in states like Ohio and Illinois. The Northeast featured the lowest total, with 548 alcohol-related fatalities.
Illinois alone reported 162 DUI fatalities during the summer period, which represents half the state’s total drunk driving fatality numbers.
Overall, there were 4,506 alcohol-related fatalities during the summer months, a 36.7% share of the year’s total number (12,429). With well over a third of the annual fatality numbers, the danger of the summer period is clear to see. And there seems to be far more of a punitive deterrent against drunk driving in some areas compared to others.
Affluent Area Incarceration Rate Disparities
As of 2022, the median national incarceration rate in the United States was 541 individuals per 100,000 residents. Those numbers cover inmates held in state prisons, federal prisons, and local jails.
This rate places the U.S. high on the list of countries that incarcerate the most people. Notably, some U.S. counties feature incarceration rates that significantly exceed the national average. For instance, Cook County, Illinois’ incarceration rate is 712 per 100,000 residents, while Oldham County, Kentucky jails 648 people per 100,000.
Oakland County Michigan imprisons 598 people per 100,000, while St. Louis County, Missouri (482 per 100,000) and Hamilton County, Indiana (314 per 100,000) fall below the average figure.
These figures highlight the disparities and inconsistencies in incarceration rates across different jurisdictions within the country and show how many affluent areas jail a comparatively huge portion of their population.
With more consistency – and less leniency in places like St. Louis County and Hamilton County – we would surely see fewer cases of drunk driving and avoidable road fatalities.
Why Avoiding Complacency Is Key
Ultimately, drunk driving doesn’t discriminate by income or neighborhood, and the numbers prove it. The tree-lined streets of the Midwest and the tech corridors of the West Coast are just two wealthy areas yearly featuring a disproportionate share of the nation’s drunk driving fatalities.
As it’s summer driving season, it’s crucial that we drop any complacent ideas about affluence equaling safety. Public safety officials, community leaders, and families alike need to accept that drunk driving is a universal threat, and that lives will be lost behind the wheel in every U.S. county, privileged or otherwise.
At Therman Law Offices, we’re personal injury experts who provide zealous advocacy for all our clients. If you think we can help, get in touch with us today.


